
by Tony Thomas
April 01, 2015
Tony creates pixel-perfect UI kits & icons. His pug, Wednesday, is Medialoot's beloved mascot.


How to Create a Smooth Segmented Chart using Sketch 3 App
Data presentation with Material design influences
This tutorial will teach you how to create a simple line chart, inspired by Google Material design principles using primarily the vector tool, gradients and masks in Sketch 3 app.
Step 1
Open Sketch App and start by drawing a very large rectangle on the canvas to use as a background layer, this is an optional step but it does provide contrast between the background of the chart and the canvas color which will both be white.
Step 2
Next draw a smaller rectangle which will be the containing box around the chart. The dimensions should be 860 x 540 with a white background fill, no border and a subtle shadow:
Step 3
In the layers panel right click on both layers and select Lock Layer.
Step 4
With the Line (L) tool draw the first vertical grid line. To help you figure out where to place it, the bottom point of the line should be 70 pixels from the bottom and left of the containing box. The line itself should be 340 pixels in length.
Step 5
Duplicate the line 9 times, moving it 80 pixels to the right each time:
Step 6
Use the Text (T) tool to add some labels in between each grid line.
Step 7
Also create a text heading for the chart.
Step 8
We are now ready to draw the data for the chart, the desired effect will be a smooth wave. Begin by selecting the Vector (V) tool and click to place a point on the first grid line. Then click and hold the second point slightly higher on the next grid line, and with the mouse button still held down, drag the handles out until they are roughly in the middle of two grid lines as shown below:
Step 9
Repeat this process creating a vector point on each grid line, to create a smooth wave shape:


Step 10
After drawing the next vector point, change the handle type to Disconnected and remove the right handle by dragging it back in towards the vector point. This will give you a straight corner when you draw the following point.
Step 11
Hold down the Shift key while creating the next two points to constrict them to perfectly straight lines. Go to the bottom of the last grid line and then all the way over to the bottom of the first grid line.

Step 12
To finish the path and complete the shape, click Close Path.

Step 13
Now let's give our wave some color. Remove the border if it has one and apply a Gradient fill instead. The arrow buttons can be used to quickly rotate the gradient and make it horizontal. Set the color stops to #61FSD2 and #1C9BF7. I strongly recommend saving this as a new preset to save time later.
Step 14
Change the Opacity of the 'Path' layer to 50%.
Step 15
Duplicate the 'Path' layer and then on the new 'Path 2' layer edit the vector shape. First click Open Path and then delete the bottom two points so that all you have remaining is a wavy line from the left to the right (this will look kind of wonky at first, but don't worry!)


Step 16
With the 'Path 2' layer still selected, remove the gradient fill and instead apply a 3 pixel Border, using the same gradient (you did save it as a preset right?).
Step 17
Select both the fill and border path layers ('Path 1' and 'Path 2') and hit CMD+G to group them. Rename the group to 'Wave'.
Step 18
Create a new rectangle on a layer above the 'Wave' group, this is for the highlighted segment and should be around 40 pixels taller and 40 pixels wider than the actual grid segment in order to give the illusion of depth.
Step 19
Select both the 'Wave' and 'Rectangle 3' layers and duplicate them.
Step 20
Select the duplicated 'Wave 2' and 'Rectangle 4' layers and go to Layer > Mask with Selected Shape or click the Mask icon in the toolbar.
Step 21
Expand the 'Wave 2' group in the layers panel and select the sub-group also called 'Wave 2'. Use the bounding box/transform controls to increase the size of the wave around 5-10% and give it a "zoomed-in" effect.
Step 22
Now expand the 'Wave 2' subgroup that you just resized, and select the 'Path 2' layer within. This is the layer with the border, increase the Thickness of the border to 5.
Step 23
It is still a little difficult to distinguish between the zoomed in section and the original wave, so let's go back to the original 'Wave' group and reduce the Opacity value of the whole group to 75%.
Step 24
And to cement the illusion of depth, select the 'Rectangle 3' layer and apply a Shadow. There is now a clear distinction between the base chart and the highlighted segment.
Step 25
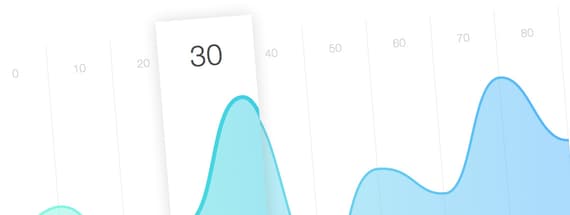
Finally, let's just add back in the text label for '30' that is now hidden, but make it much darker and larger this time.
Result
Here is the final result, an undoubtably very simple chart but a very pretty one!


Comments